TCX Plot Help
Table of Contents
TCX Plot Website
Table of Contents
- Home Page
- Dropdown Menu
- TCX Plot on Mobile
- Single Device Plots
- Heart Rate Plot with MAE Comparison
- Map with Clickable Points
- Metrics Summary Report
The TCX Plot website provides a convenient platform for visualizing and analyzing TCX data files. Here's a step-by-step guide to using the website:
- Visit tcxplot.com to access the website.
- Log in with your Google account. The website utilizes Google authentication for seamless access to your Google Drive files.
- After logging in, you will be directed to the home page, which displays a file browser of your Google Drive.
- Navigate to the folder containing your TCX data files.
- Click on the "Action" button, which provides context-sensitive options based on whether you are on a TCX file, other file, or folder. If you select a folder, you can set it as your TCX folder, and subsequent logins will direct you to that folder.
- Once you reach a folder with TCX files, click on the files to plot them. The selected files will appear under the file browser in a list above the "Analyze" button. Once at least one file has been selected, the Analyze button will be enabled. Click the button to generate the report.
- Click on the "Analyze" button to proceed with the analysis of the plotted TCX files.
- The analyzed data will be displayed, and you can optionally save a copy back to the folder on your Google Drive.
- If you select a ground truth device, reference device, and device under test, the website will generate a table comparing the device under test to the reference and ground truth devices. This table includes metrics such as the Mean Absolute Error (MAE) of the line graphs.
The TCX Plot website is designed to be responsive and can be accessed from various devices, including smartphones, laptops, and any other platform with a web browser.
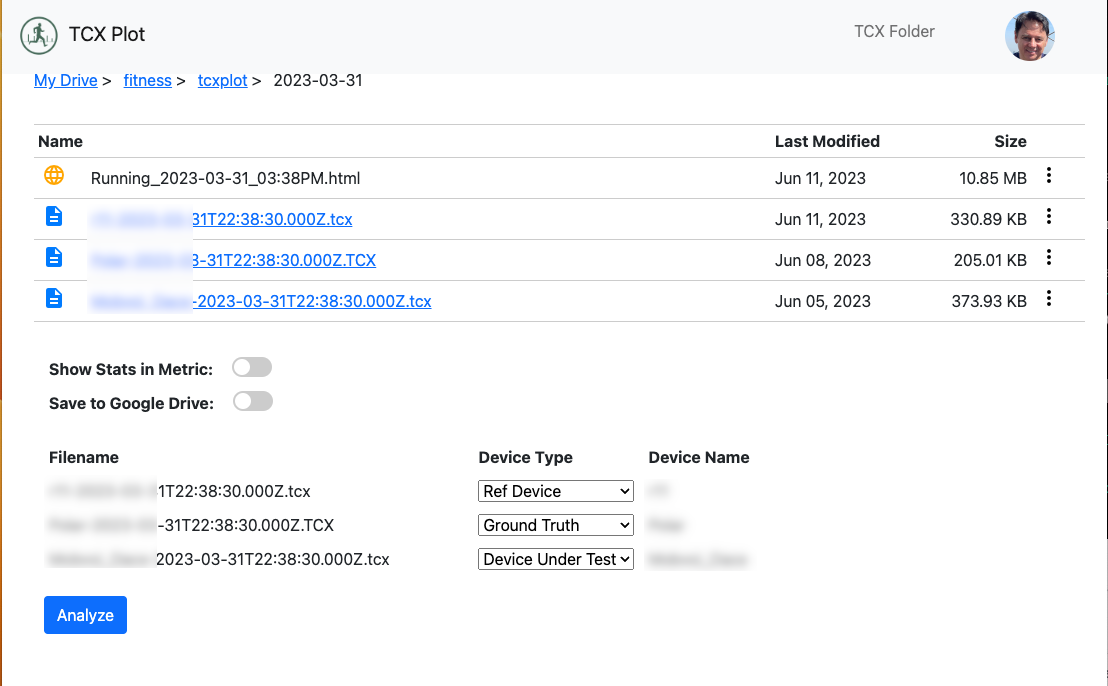
Home Page
The home page is where the user lands after logging and is where most functions are performed. The user nagivates to the google drive folder with the TCX files. It's recommended that the user set the TCX Folder link using the drop down menu. This will result in the user being brought directly to the TCX Folde on login instead of the root folder.
Once the user has navigated to the folder with the TCX files, the user can cick on a TCX file and it will be added to the selected files table above the Analyze button. The system will attempt to determine the device type automatically. The user can override this in the dropdown menu if necessary.
After one of more TCX files are seledcted, click the Analyze button to view the charts and map. An example screenshoot of the home screen is below:
Home Page
Dropdown Menu
In addition to clicking on a TCX file to add it to the selected file list for analysis, there are context sensitive commands for each file. The three vertical dots is the button to activate the dropdown. The commands depend on the type of file / folder. Some examples are shown below.
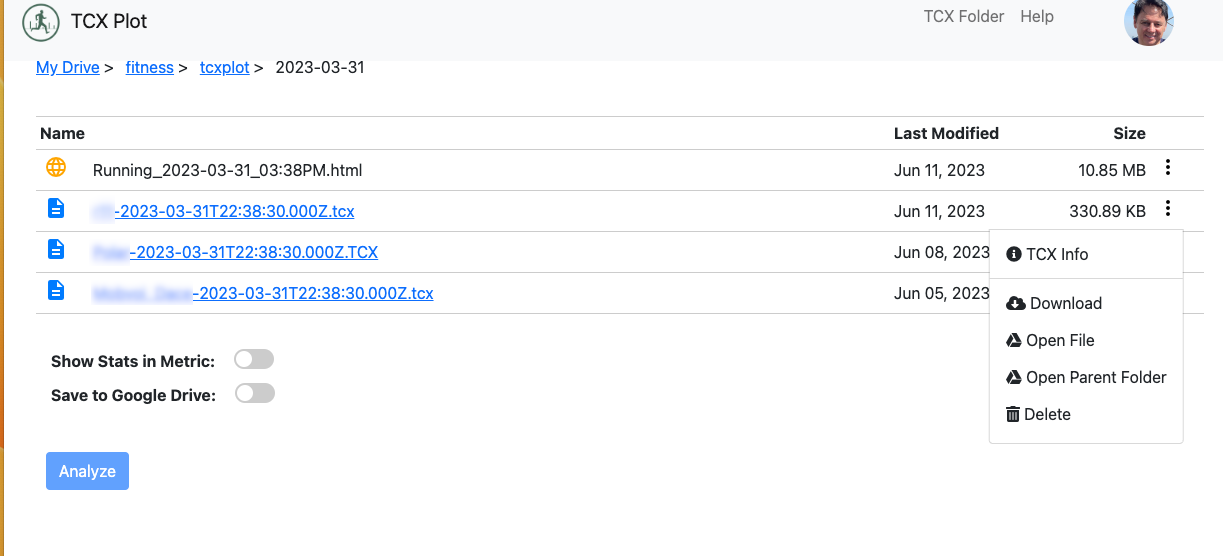
Dropdown Menu - TCX File
TCX files have an extra command called TCX Info which will give summary information about the TCX File. All other files will have the commands below the devider in the screenshot below.
The other commands include:
- Download - Downloads the File
- Open File - Opens the file in in a new browser tab to the GDrive file viewer for the filetype
- Open Parent Folder - Opens a new browser tab and nabigates to the Google drive folder containing the file
- Delete - deletes the file
The TCX Info command shown above will result in a TCX Summary popup modal being displayed. This give the user s quick overview of what information is contained in the TCX file. For example, if a user wants to quickly check if their file has heart rate data they can see this is a few seconds by using this command. A example of the summary is shown below:
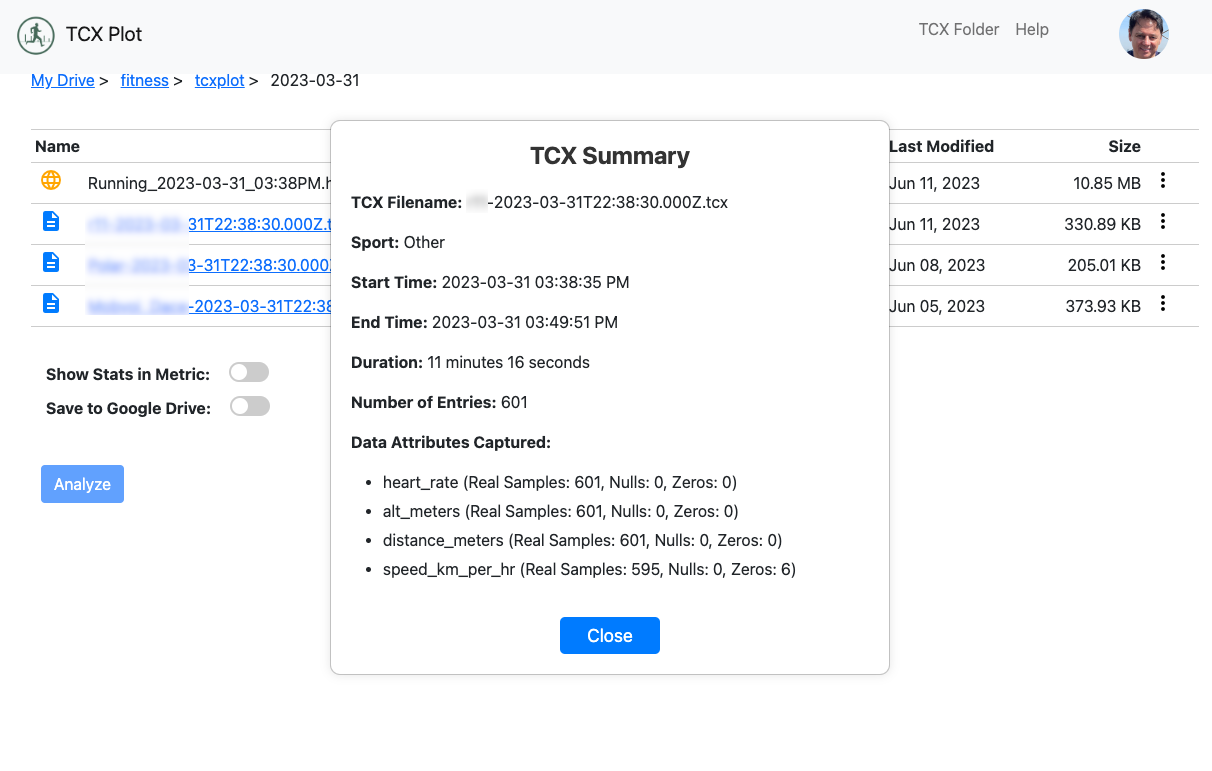
Dropdown Menu - TCX Info
The example above shows how to set the current folder as the TCX Folder. Once set, this will be the folder that gets navigated to on login. You can also lick on the TCX Folder in the nav bar to navigate to this folder once it has been set.
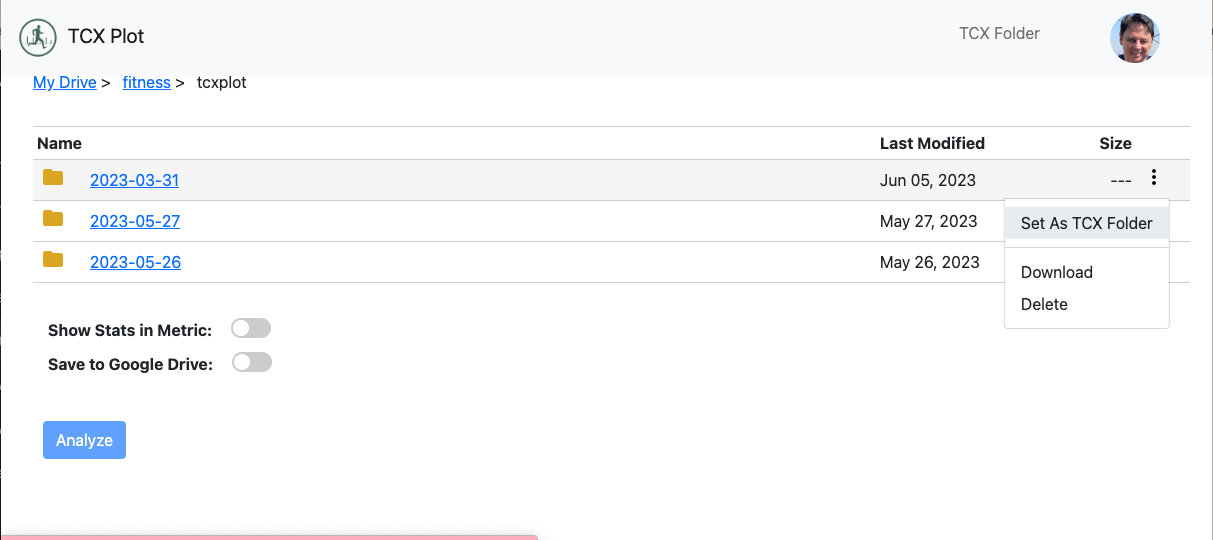
Dropdown Menu - Set TCX Folder
TCX Plot on Mobile
TCX Plot applies responsive design principles in order to facilitate ease of use across multiple device form factors. In order to make it easy to quickly see your analysis and confirm the data from your workout is complete, mobile and tablets were a high priority use case. TCX Plot's user interface will dynamically adapt to the user's screen size and orientation. The layout flexibly responds to changes in viewport size to ensure optimal readability, navigation, and interaction. For example, on smaller mobile screens, the elements contract and rearrange to accommodate the limited space, while on larger tablet or desktop screens, the elements expand and adjust for an optimal layout. Some mobile screenshots are below:
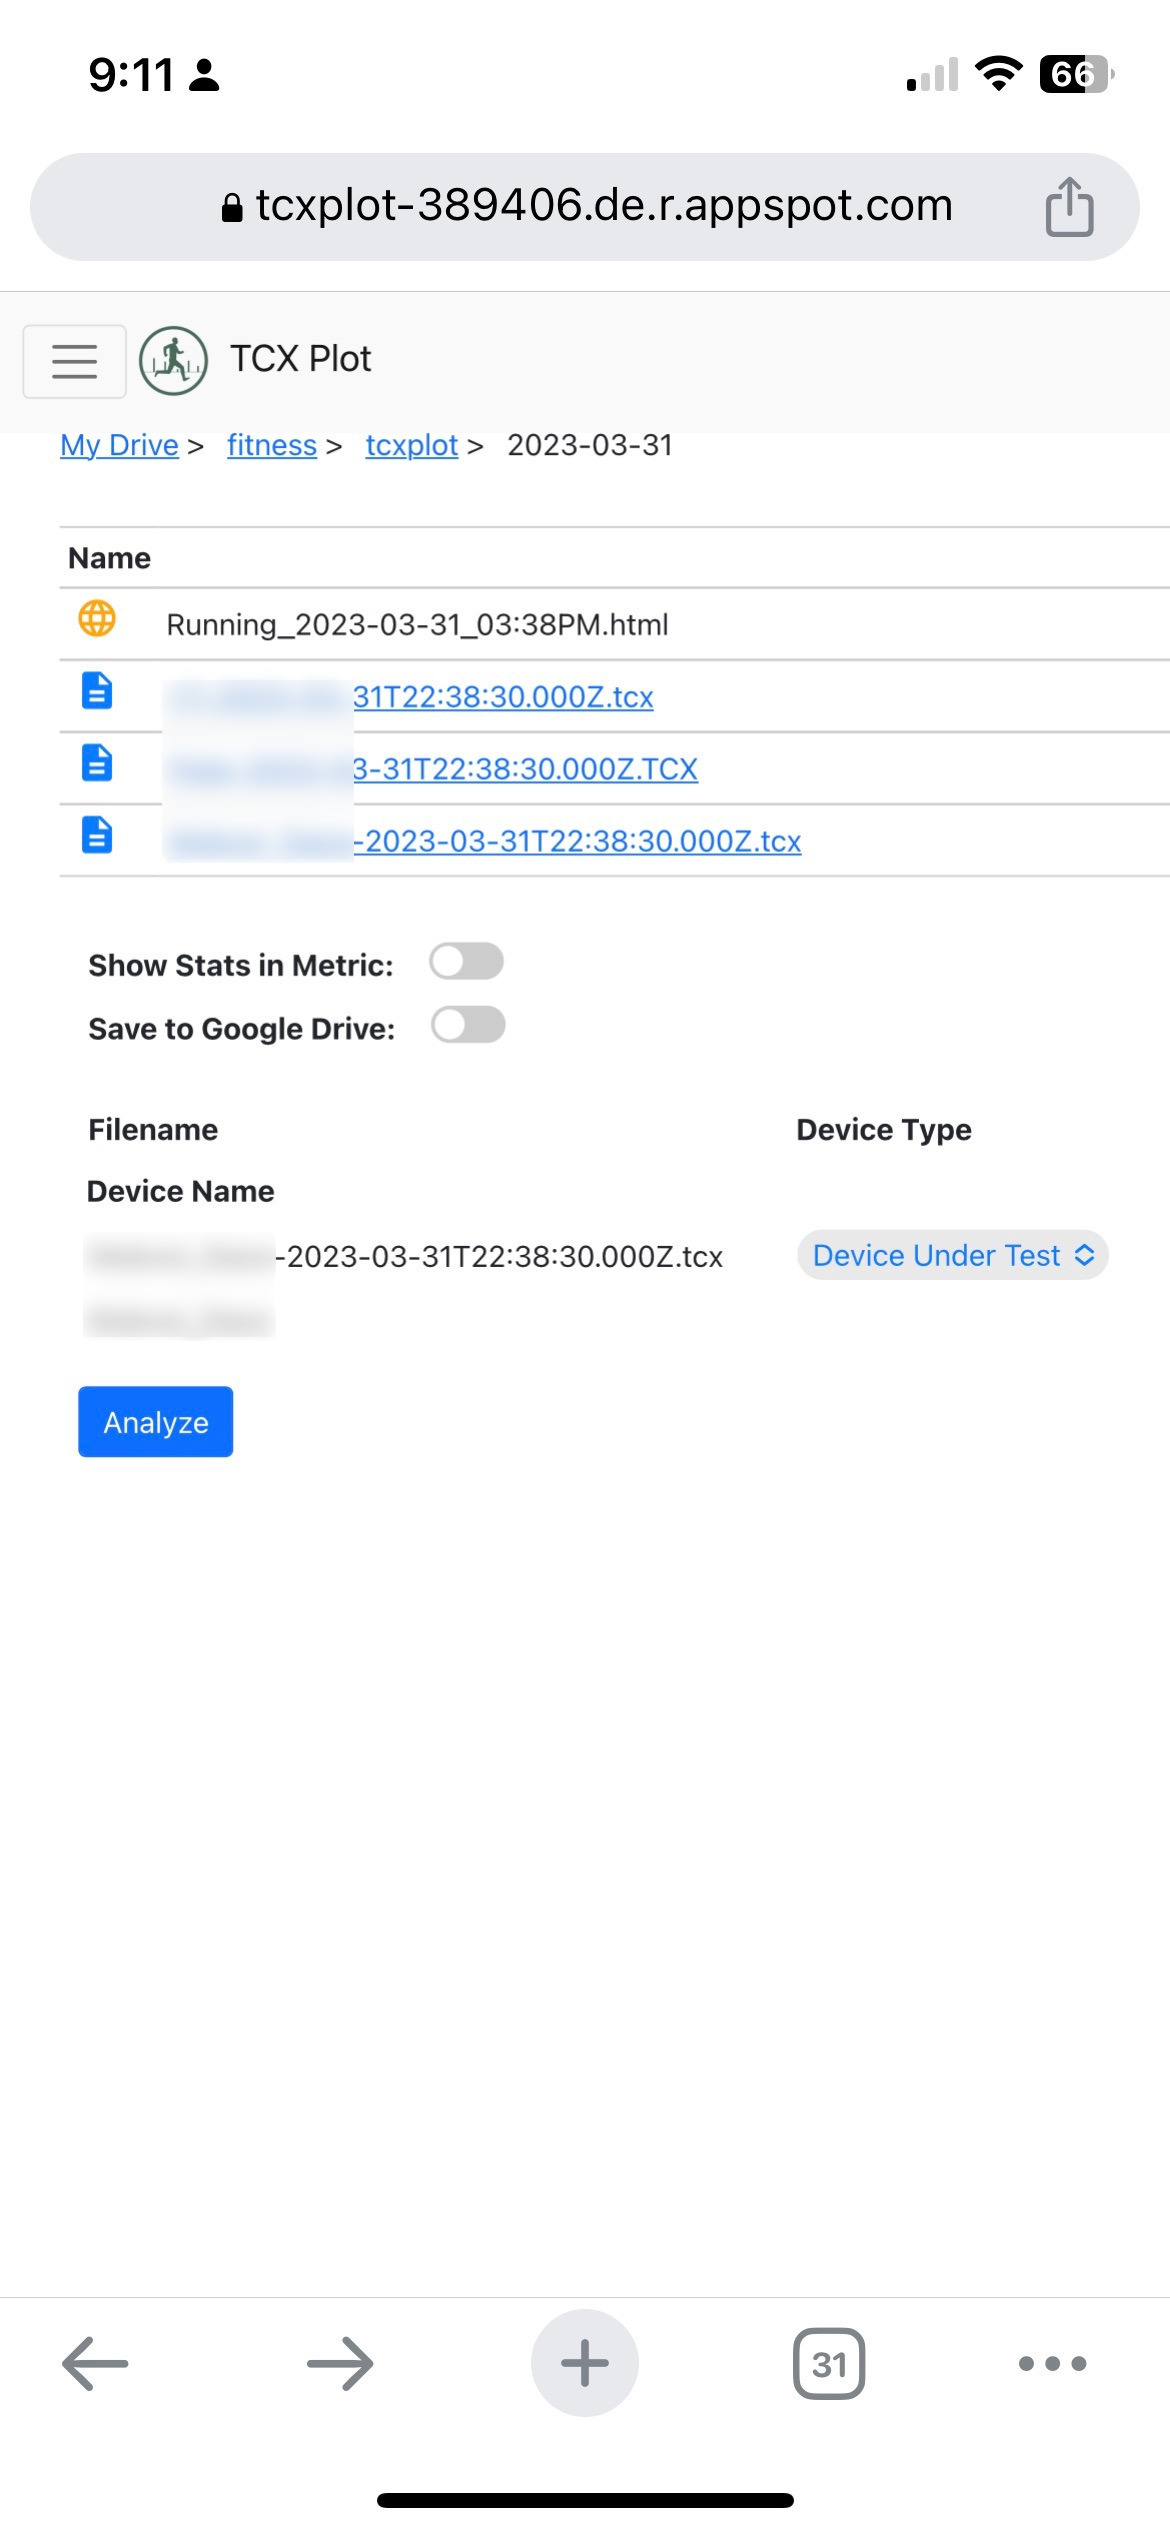
Mobile View - Home Screen
Although its easier to read the graphs and maps on a desktop or laptop, the mobile or tablet views are sufficient to quickly see if the data is good and also to get a sense of how the device performed relative to the reference or ground truth device. The example below is in portriat but landscape is also supported and the graphs look good on a tablet as well.
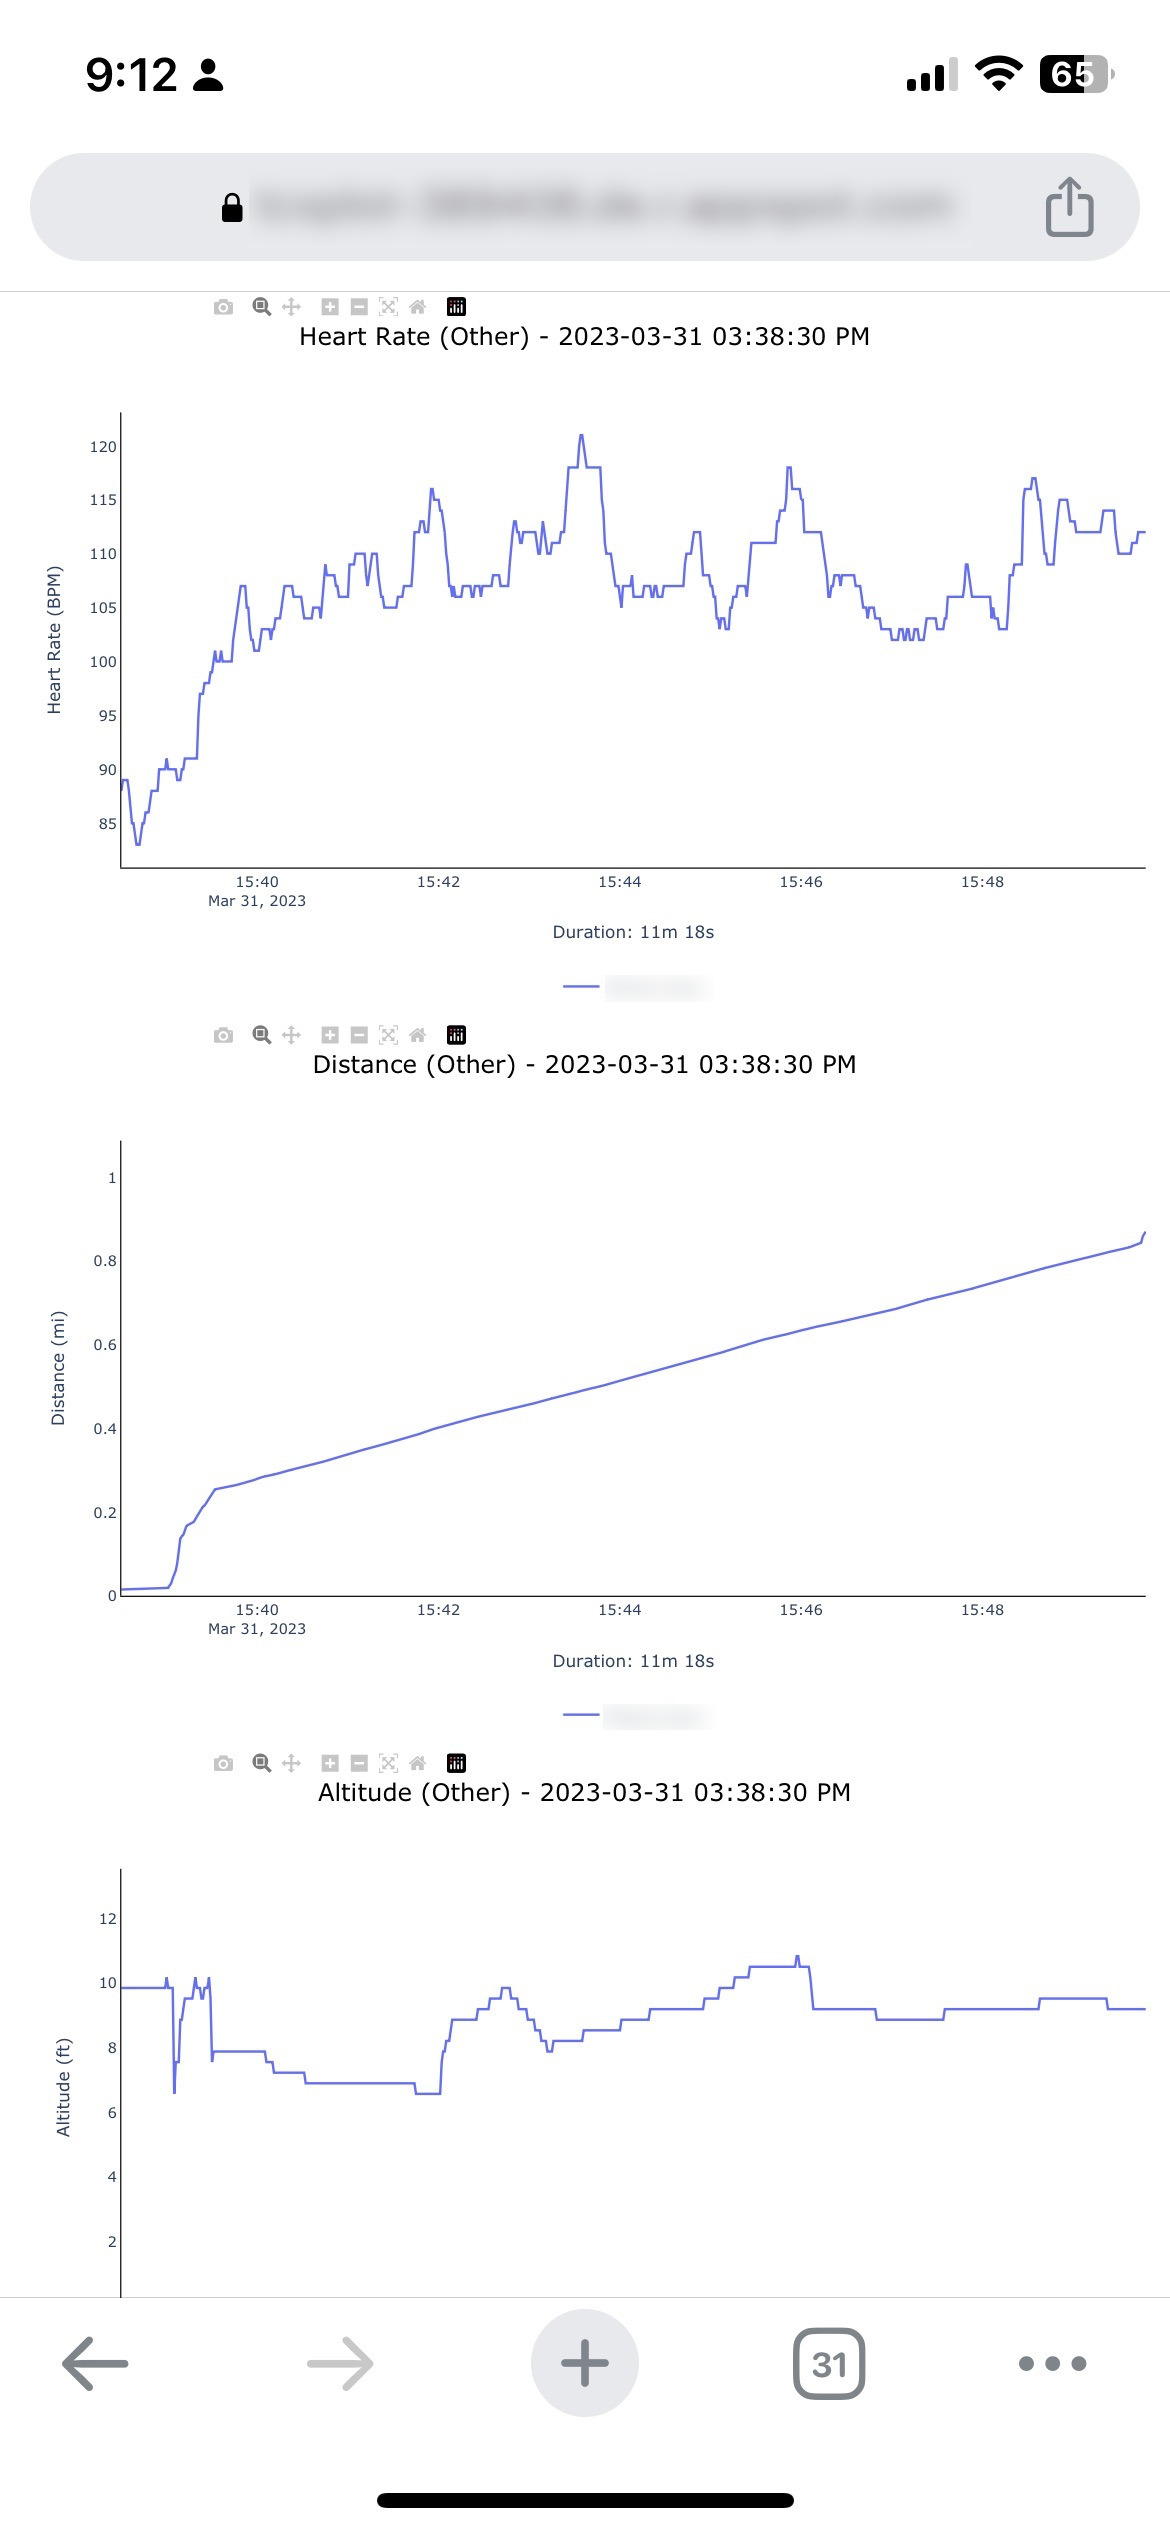
Mobile View - Plot
Single Device Plots
Sometimes users just want to see a plot of one device. Other times users want to benchmark a devices that are using against a reference device or a device that is know to be the source of truth for comparison or 'ground truth devices'. TCX Plot supports both of these use cases. Below is an example of a single plot.
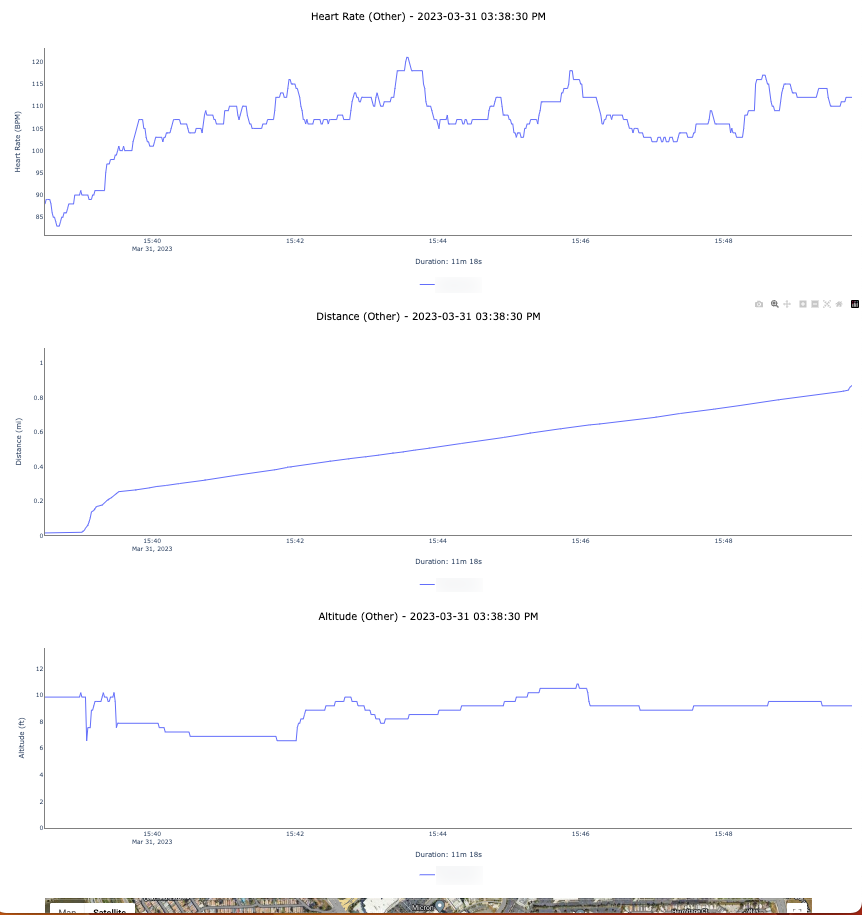
Single Device Plot
Heart Rate Plot with MAE Comparison
If the user selects a ground truth file and a reference device file with their device under test some additional statics will be show on the plot. In the example below the MAE (Mean Absolute Error) comparison is shown:
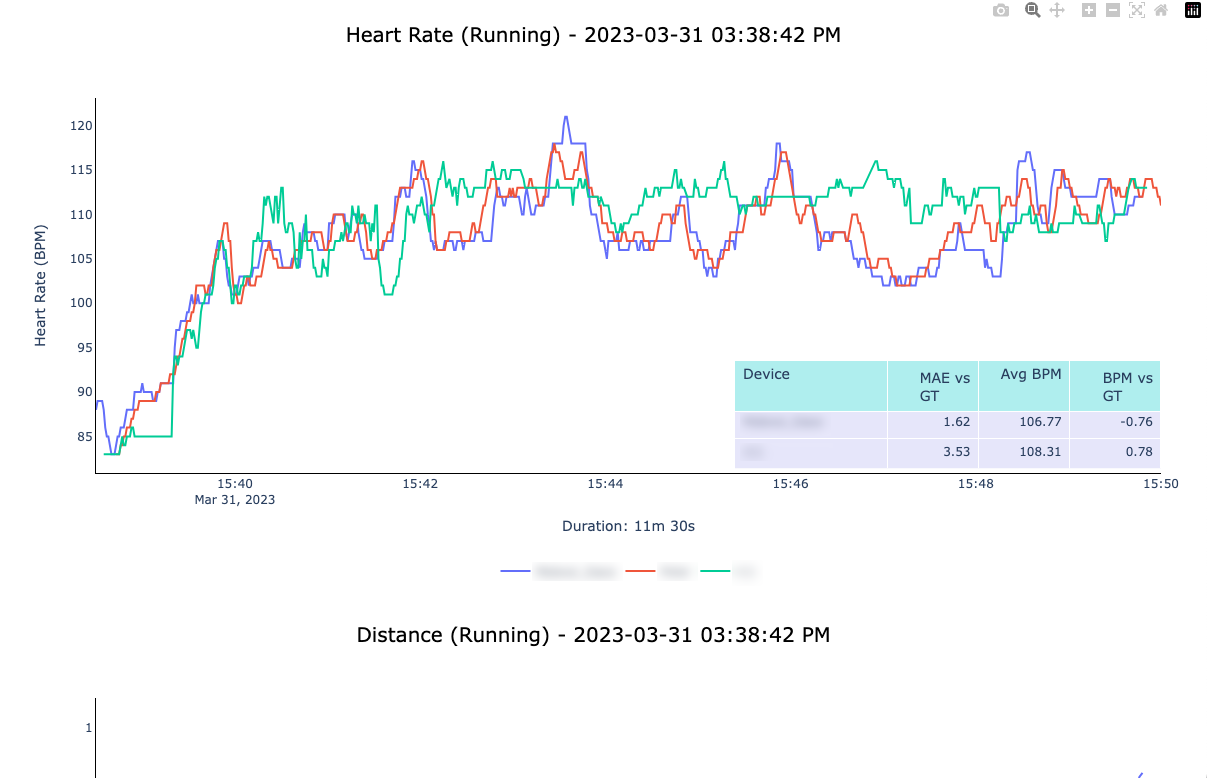
Heart Rate Plot with MAE Comparison
Map with Clickable Points
The map producted by TCX Plot is fully interactive. Users can zoom in and see the track points for each device in the plot. The track points are also clickable. When clicked an pop up info dialog is shown with addition metrics corresponding to that track point. This can be useful to check if the timestamps where in sync for track points of differnt devices at the same location. This can help troubleshoot the heart rate graphs since if the clicks are off, the lines will be shfited on the timeline. An example is in the diagram below.
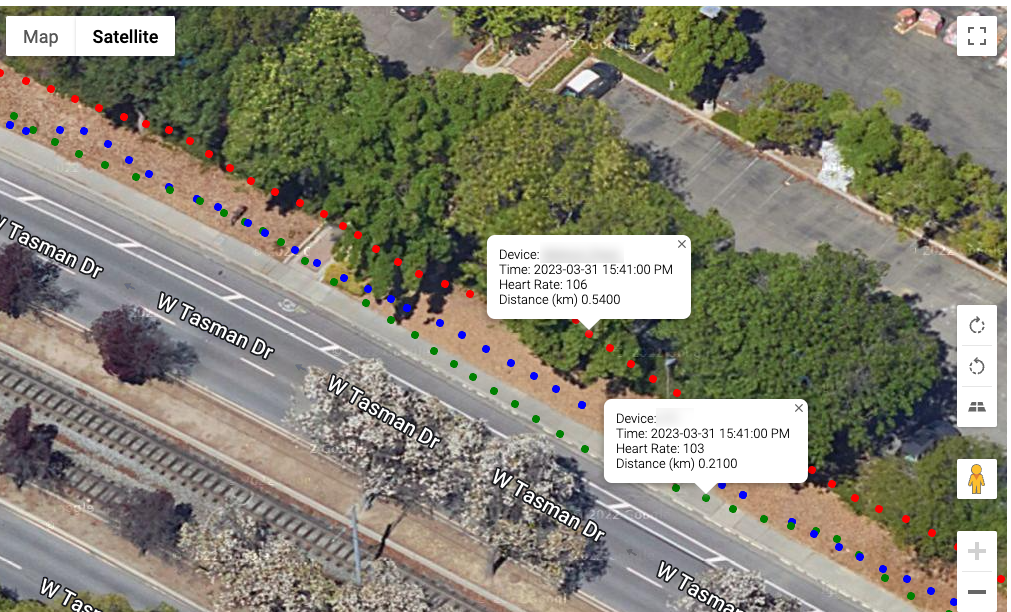
Map with Clickable Points
Metrics Summary Report
This report allows the user to generate metrics on a large dataset of tcx files. This is useful for QA test teams who generate hundreds of tcx files and need a way to generate the stats automatically. It also useful for regular users who want to benchmark their library of data against a reference or ground truth device.
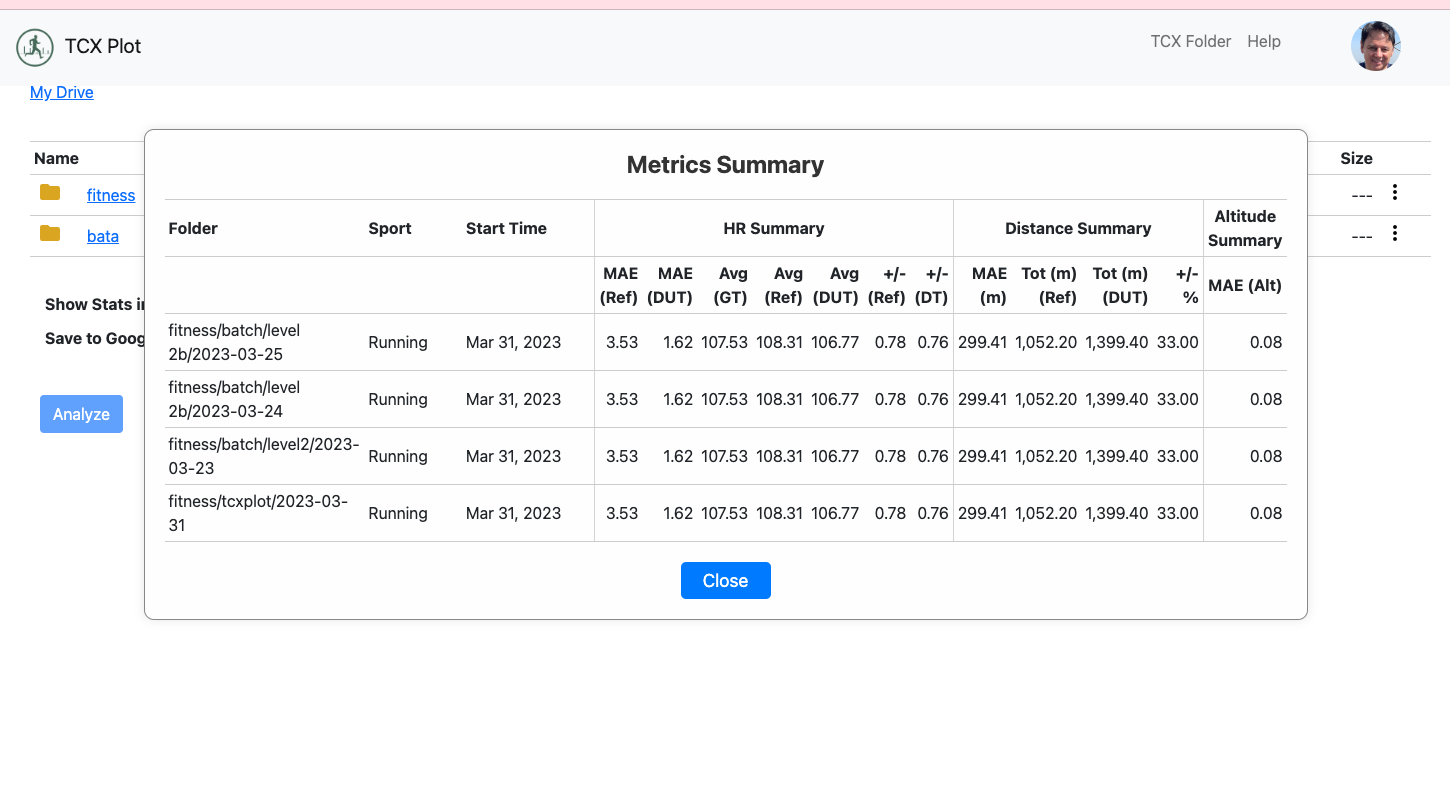
Metrics Summary
This feature allows the user to statics display multiple activities (exercises) at once. The users can select a folder and run the "Process Metrics" command from the dropdown menu.
The Process Metrics command will scan all the sub folders recursively of the selected folder. It supports an atbitrary number of levels deep. It will scan the folders for a set of files which are of type tcx and are fit a profile for one of eacdh device type (gt, ref, and dut). When found it will calcuate the MAE statics (Mean Absolute Error) for a number of different sensor types as well as some other statics and display them in the model shown above.
What is TCX?
The TCX (Training Center XML) standard is a file format commonly used in the fitness and sports industry to store and exchange exercise-related data. It was developed by Garmin, a well-known manufacturer of GPS devices and fitness trackers. TCX files contain information such as GPS coordinates, heart rate data, timestamps, and other metrics associated with activities like running, cycling, and swimming.
The TCX XML format is based on the XML (eXtensible Markup Language) standard, which is a flexible and widely adopted markup language for structured data. TCX files are human-readable and can be easily parsed and processed by software applications.
The TCX schema defines a set of elements and attributes that can be used to represent various aspects of exercise data. Some of the key elements in a TCX file include:
- Activities: The root element that encapsulates all activities recorded in the file.
- Activity: Represents an individual exercise session, such as a run or a bike ride.
- Lap: Represents a lap within an activity, allowing for the division of activities into segments.
- Track: Contains a sequence of track points that define the path followed during an activity.
- Trackpoint: Represents a single point along the recorded track and includes information such as timestamp, position, and sensor data (e.g., heart rate, speed).
TCX files can also include additional information, such as the athlete's name, device information, and various extensions specific to different devices or software platforms.
Overall, the TCX XML standard provides a structured and standardized format for storing exercise data, making it easier to share and analyze fitness-related information across different platforms and applications.